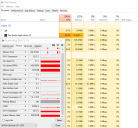
GPU usage during a render
 Neo2remember911
Posts: 5
Neo2remember911
Posts: 5
Hello all!
I'm very new to the rendering scene, not even a week in. I have what is going to be a stupid question i think for you guys (I'm sorry). My specs are below for reference, I've done some testing with a few renders now, some larger and some smaller. At first my GPU wasn't running during a render at all, caused some what should of been easier renders to take hours i presume. I updated my drivers through nvidia website directly and during the lower end renders i've seen my gpu usage make effort again so i think that problem is solved!
Question time..
When rendering, inspecting both the task manager AND GPU-z, a small render will show on task managers GPU % usually saying it's using between 1-15%. In GPU-Z everything cranks up in glorified fashion whether the render is small or large. When rendering a much bigger scene the GPU % is always at 0%, GPU-z again shows everything running like normal. (Screenshot of this below) My question is, i notice at all times the VRAM on the GPU is always maxed out in GPU-z, so no question DS is making use of it. Why does the GPU% In task manager not show anything during the bigger renders though? Does the card not use anything other than VRAM if the scene is too large of a render? Could someone explain that just a little for me? I'm more just curious on how this all works as a whole and learn the program.
I've done render tests with just the GPU, GPU + CPU, GPU with Optix and GPU + CPU with optix and found that it renders quicker with everything turned ON. In case anyone is curious. My specs:
i7-7700k
Gtx 1070
32 GB Ram
Windows 10
Daz 3D is part of 
Connect
DAZ Productions, Inc.
7533 S Center View Ct #4664
West Jordan, UT 84084
Licensing Agreement | Terms of Service | Privacy Policy | EULA
© 2025 Daz Productions Inc. All Rights Reserved.
Comments
Task manager is a very basic tool and doesn't really report GPU metrics very well.
You can see what is going on with your GPU, somewhat, in TM bu going to the performance tab, selecting the GPU, selecting a graph, selecting the title and choosing CUDA from the drop down list. When the GPU is rendering a scene that graph should show almost 100% usage.
Thank you for your reply, the graph doesnt show anything happening under the Cuda tab. I attached a screen shot, it shows just like on GPU-z that the memory is being used, i'm currently in the same render when i made this post initially. Being that the cuda graph shows nothing happening could something still not be working right with the GPU's portion of the render or could this just fall under TM being faulty and not showing it correctly?
I also have another question with errors and warnings in my log files, I attached another screenshot of my log file during this current render and i keep seeing it say that it's falling back onto the cpu because of it not being able to allocate the required bytes from the GPU, does this mean the GPU effectively aborted the rendering mission and is relying soley on the CPU at that point? I would imagine the GPU would tackle whatever it could handle during the process then rely on the CPU for the remainder, or am i getting this all wrong? For some reason i just feel like there's a problem i'm suppose to fix as far as the GPU not doing what it needs to? Can someone debunk me.
That graph appears to show your GPU is not rendering at all. The log shows the same.
Try this, reboot your computer, open Daz. load a single very basic prop. Render that. Observe TM and your log file. If the render completes with teh gpu using CUDa then you're just having an out of memory issue.
Always be sure to close old preview windows when starting a new render. Open render windows consume GPU VRAM.
I've done as you suggested, screenshot attached. Looks like during a lower render the cuda cores are active, assuming all is well other than as you mentioned, the out of memory disorder.. So can you tell me a little about that? Because the VRAM isn't high enough to take on a bigger render it simple doesn't try at all? The cuda cores will only engage when the VRAM is higher than the rendering scene? Sorry for all of the questions, looking for a way to get around this. When the cuda cores are engaged these renders go by so quickly. Would the goal be to load individual scenes and piece them all together post render? That'd be a bit of a headache but seems like when given a big task, my render times aren't doubled they turn a 10 minute render into a 3 day process.
iRay only uses a GPU for rendering if the whole scene fits entirely on the card. So if you exceed that amount you drop yo CPU which is an order of magnitude, at least, slower.
Generally speaking 8Gb of VRAM is quite a lot. If you're routinely exceeding that you may need to consider some options. Scene Optimizer is a product that is soldin the store here which reduces various elements of scene to reduce memory usage. That would be the first thing I'd try. Second, if that doesn't work, then you could certainly render scene subsets and composite them together.
One other thing to lookout for, subdivision setting on figures. I accidently have set them too high somehow, maybe bad mouse aim or something. too much geometry and too large textures are usually the culprit in my case. Scene optimizer is well worth grabbing.
Thank you both for your responses! I've went ahead and purchased the scene optimizer, it's taking me a little while to find where DIM put it and how i'm suppose to use it (man this stuff can be a little complex for a beginner) I thought 8gb VRAM would suffice as well, i am rendering 2 figures in a room with 2 props in total. Shouldn't be too much to ask for i don't think but i do have the render settings higher up for the best quality. I went ahead and checked my figures for subdivisions and they are set at their default 1 value so i think all is well there, i'll update later after i figure out what i'm doing with scene optimizer to share my results. Thank you both!
It should be somewhere in the scripts folder, maybe in a V3Digitimes sub folder. I rearrange everything, so not sure where the default spot is exactly. The way I use it, right click on the V3DSO 02 Scene Optimizer icon, then create custom action. It will add it to a scripts menu at the top of DS, makes it super easy to find. My method of using it, first I ask myself is this a closeup? If no, I cut all the 4k figure maps in half, no need for 4k maps unless it's a closeup. The rest I try to get all the maps under 4k, unless it's close up and not blurred by DOF. If I can see stuff I know for sure is far in backround. I may take them as low as 1k or even 512 by 512 depending how far they are.
Using the scene optimizer tool the GPU is now able to engage in the scaled down scene! Thank you guys for the assistance i really do appreciate it. I looked up a video on someone using the scene optimization tool and they had a Scripts menu docked at the top of their main menu bar. I don't have that option, have been trying to figure out how to dock that option for myself, when this scene renders i'm going to try what you said and right click on the scene optimizer icon and see if i can create a custom action and dock it that way. I was only able to find the tool under the Content Library pane, left hand side. I tried to navigate to the folder it was installed in and got a little lost. ALSO, thank you for sharing your practice for cutting down on maps, that'd be a good rule of thumb for me to try and practice. The further away in the scene a node is, cut the map a little more than nodes that are closer to the camera. That along with the DOF like you said can help what matters in the scene stand out more compared to what's just in the background. Is there a DOF slider in DS? Like some tool that adjusts the focus around the center of the scene?
Yeah, the right click should do it. And you can move stuff around in that menu by going to window menu > workspace > customize(f3 is the default shortcut to get there as well), on the right side, go to the menu tab . There is a ton of things you can do to make it a more customized layout, one of the things I like about DS.
Yup! Right clicking the optimizer and creating a custom action did the trick, created the scripts tab at the top like in the video, thank you!